 RAIVYN
Know More. Decide Better. Run Smarter.
Your business generates valuable information every day. RAIVYN helps bring it together through business intelligence dashboards, automated reporting, and clear operational insights, so you can spend less time chasing numbers and more time making informed decisions.
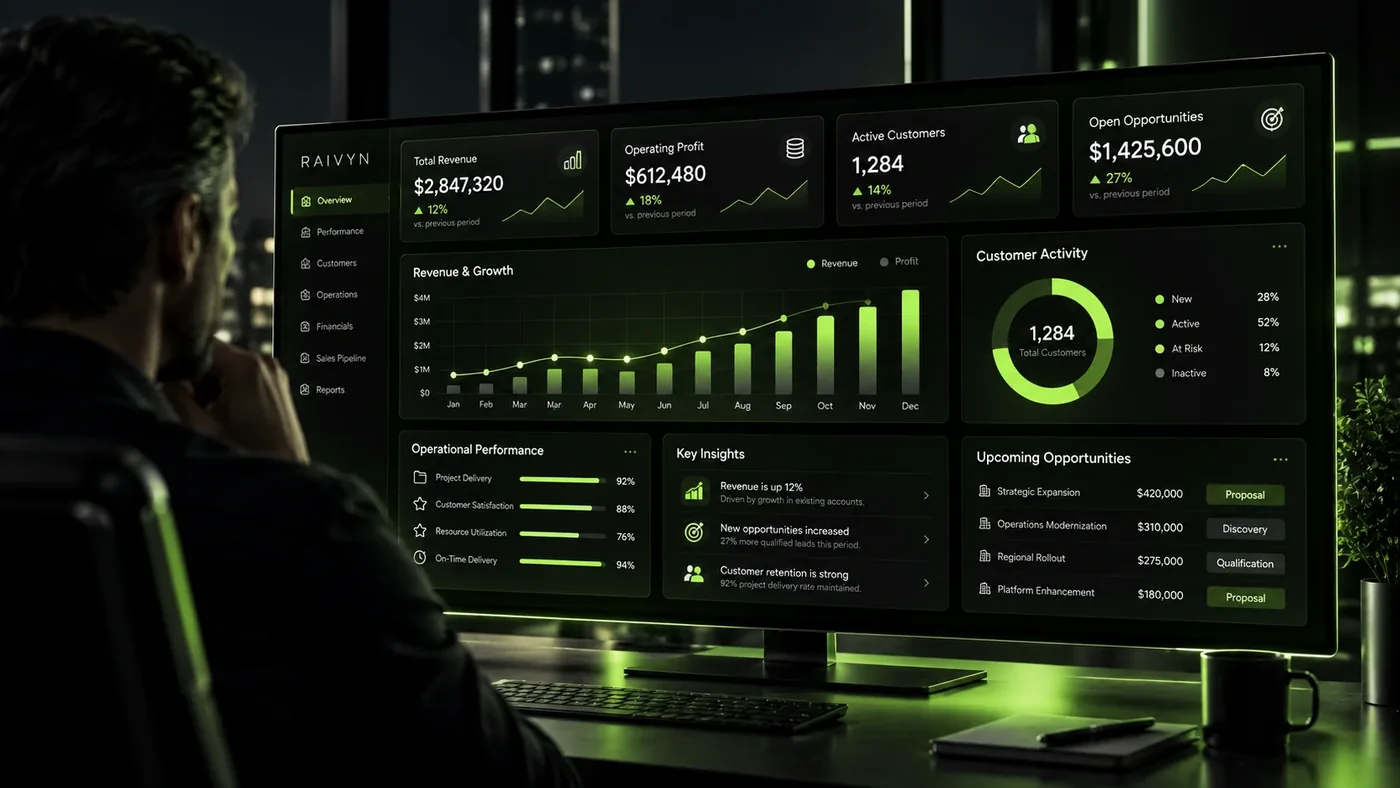
The dashboard on this page uses sample data only.
Your Data Is Everywhere. Your Answers Shouldn’t Be.
Sales figures live in one system. Expenses live in another. Operations are tracked in spreadsheets. By the time reports are assembled, the information may already be outdated.
You should not have to spend hours gathering data just to understand what happened yesterday.
Scattered reporting
Numbers in several tools, assembled by hand, already out of date when they arrive.
Clearer visibility
The figures you manage by, gathered in one place and refreshed on a schedule you choose.
See What Matters to Your Business.
The right dashboard starts with the questions you need answered. Track key performance indicators, spot changes sooner, identify bottlenecks, and give the right people a clearer picture of performance. Examples below are generic and illustrative.
From Disconnected Information to Clear Next Steps.
We begin with the decisions your team needs to make. Then we identify relevant data sources, design useful reporting, and build dashboards or automated summaries that put information in context. Your team remains responsible for important business decisions.
- 01
Decide
Start from the decisions your team needs to make.
- 02
Unify
Identify the data sources that inform them.
- 03
Clarify
Design reports and dashboards that put numbers in context.
- 04
Act
Review results with your team and refine what you track.
The Right Intelligence for the Right Decisions.
Sales leaders need pipeline visibility. Operations teams need to see where work slows down. Finance teams need clearer spend reporting. Executives need the bigger picture. RAIVYN connects information to the decisions each team makes.
Operations
Spot recurring bottlenecks, workload trends, and unresolved work.
See How Your Numbers Could Come Together.
Explore an example to see how activity, trends and key performance indicators might appear in one view. Every business is different; your actual dashboard would be designed around your systems, goals, and reporting requirements.
Illustrative dashboard. Sample data, not real results.
Revenue (sample)
Sample bookings by period. Fictional numbers for illustration.
Useful Insights. Clear Ownership.
Business intelligence is only valuable when the information is reliable and appropriately protected. We scope data access, clarify where information comes from, design review points, and build reporting around your organization’s policies and needs. You never need to share credentials or files on this page.
Access
We agree with you which systems and people can see which data before anything is connected.
Data quality
Reports are only as good as the data behind them. We note where figures come from and flag where they are incomplete.
Human review
Dashboards inform decisions; people make them. Automated summaries are designed to be checked.
Audit trails
Where a project needs to show who changed what, we scope that during discovery. We do not assume it.
What Would Better Visibility Change for You?
Not sure where to start? Tell us what you need to understand, where your information currently lives, and what slows your team down. We’ll use that context to explore a practical reporting solution.
Your outline
Nothing is sent from this page. Continuing opens the contact form with this outline filled in, where you can edit it before you choose to send.

Ready to See What Your Numbers Are Telling You?
Tell us what you need to understand. We’ll help explore the reporting that would make it easier.